
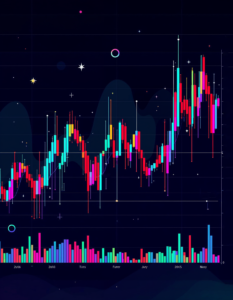
A stock market chart showing a series of candlestick patterns against a dark background, indicating the fluctuations of stock prices over time
AI, Analysis, Art, Background, Candles, Candlestick, Candlestick pattern, Candlestick-chart, Chart, Dark, Dark background, Data, Economics, Financial, Financial-data, Fluctuations, Graph, Ground, Ice, Indicators, Investment, Market, Market-trends, Pattern, Patterns, Patterns-analysis, Prices, Rice, Show, Stock, Stock-market, Stock-prices, Time, Time-series, Trading, Trend, Visual
Discover how candlestick patterns reveal market trends and price movements. Learn to read these powerful visual tools for smarter trading decisions.
Need Help? Tailor Your Visuals! Bring your creative vision to life with our expert image customization services. Utilizing cutting-edge AI technology, we adapt each visual element to perfectly reflect your brand’s style and message. Visit the Customization page for details.
If you notice anything that seems off in the customized image or if it doesn’t meet your expectations, please use our Content Report page to let us know.
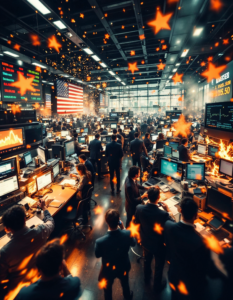
A stock exchange floor with traders frantically buying and selling commodities, capturing the volatility and excitement of the market

Analyzing patient data to diagnose and treat illnesses
A person’s hands using a tablet device to interact with various business analytics and data visualization elements displayed on the screen, including charts, graphs, and icons
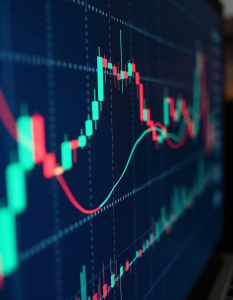
A close-up view of a computer screen displaying stock market charts and graphs with fluctuating lines and colors, suggesting financial data and analysis

A close-up of a blue butterfly with intricate wing patterns perched on a cluster of yellow flowers against a dark background

Colorful glass spheres or bubbles floating against a dark background, with reflections and refractions creating a vibrant, abstract and surreal visual effect

An old-fashioned analog alarm clock with a black frame and white dial against a dark background
A colorful chart depicting the volatile fluctuations of cryptocurrency prices

Various spices and seasonings in spoons and bowls on a dark background, including salt, pepper, cinnamon, and other herbs and spices

Assorted heirloom tomatoes in a white bowl on a dark red background with floral patterns

An open book with pages folded into the shape of a heart on a dark background

An elderly Caucasian man with gray hair and glasses painting on an easel in an art studio with various paintings and art supplies in the background

A young Caucasian woman with long dark hair talking on a landline phone in an office setting with bookshelves in the background

A welder working with a welding torch, creating bright sparks and flames against a dark background

A middle-aged man with gray hair wearing a suit and tie, holding a bouquet of pink flowers in front of his face, standing in front of a collage-style background with various patterns and textures

A close-up of a wooden violin or viola against a dark background, with the strings and fingerboard visible

A close-up of a shiny golden bitcoin cryptocurrency coin on a dark background with other bitcoins in the background

Two contrasting abstract forms or patterns placed side by side, one representing structured, traditional approaches

Trails of light weaving through a dark space, intertwining and creating intricate patterns

Sold sign superimposed on a graph showing rising property values, illustrates the investment potential of real estate

DNA strands in an abstract background