-

A scientist in a lab coat testing formulas in small vials, surrounded by ingredients, charts, and sensory analysis equipment
-

A mapmaker drawing the paths of sound waves through a canyon, their charts glowing with sonic vibrations
-
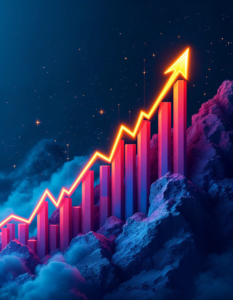
A line graph shooting upwards, visualizing the rapid growth and success of a startup
-
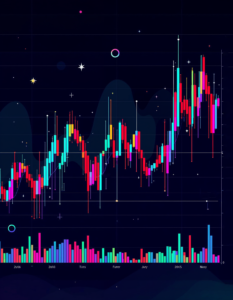
A colorful chart depicting the volatile fluctuations of cryptocurrency prices
-

Analyzing patient data to diagnose and treat illnesses
-

A doctor reviewing a patient’s health data on a holographic display, with vibrant graphs and charts revealing insights and informing personalized treatment plans
-

A computer screen filled with graphs, charts, and data points, representing the power of data-driven decision-making in digital transformation
-

A computer screen displaying charts and graphs on public health statistics, representing the importance of data in health planning
-

A screen displaying complex data graphs, charts, and analytics, symbolizing how technology aids in decision-making and business intelligence
-

A low-poly office environment with people working at desks, computers, and geometric charts on the walls
-

A person wearing a suit with wings made of graphs and data charts, symbolizing being uplifted by strategic business decisions
-
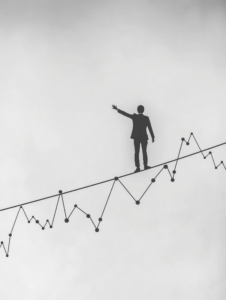
A person balancing on a tightrope made of graphs and charts, symbolizing the delicate balance required in business decisions
-
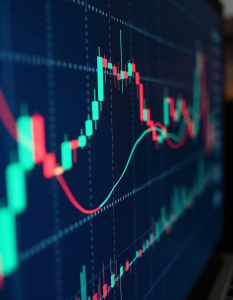
A close-up view of a computer screen displaying stock market charts and graphs with fluctuating lines and colors, suggesting financial data and analysis
-

A person’s hands using a tablet device to interact with various business analytics and data visualization elements displayed on the screen, including charts, graphs, and icons
-

A stock market chart showing a series of candlestick patterns against a dark background, indicating the fluctuations of stock prices over time
-

A middle-aged Caucasian male doctor wearing a white coat and stethoscope, examining a medical chart or document on a clipboard