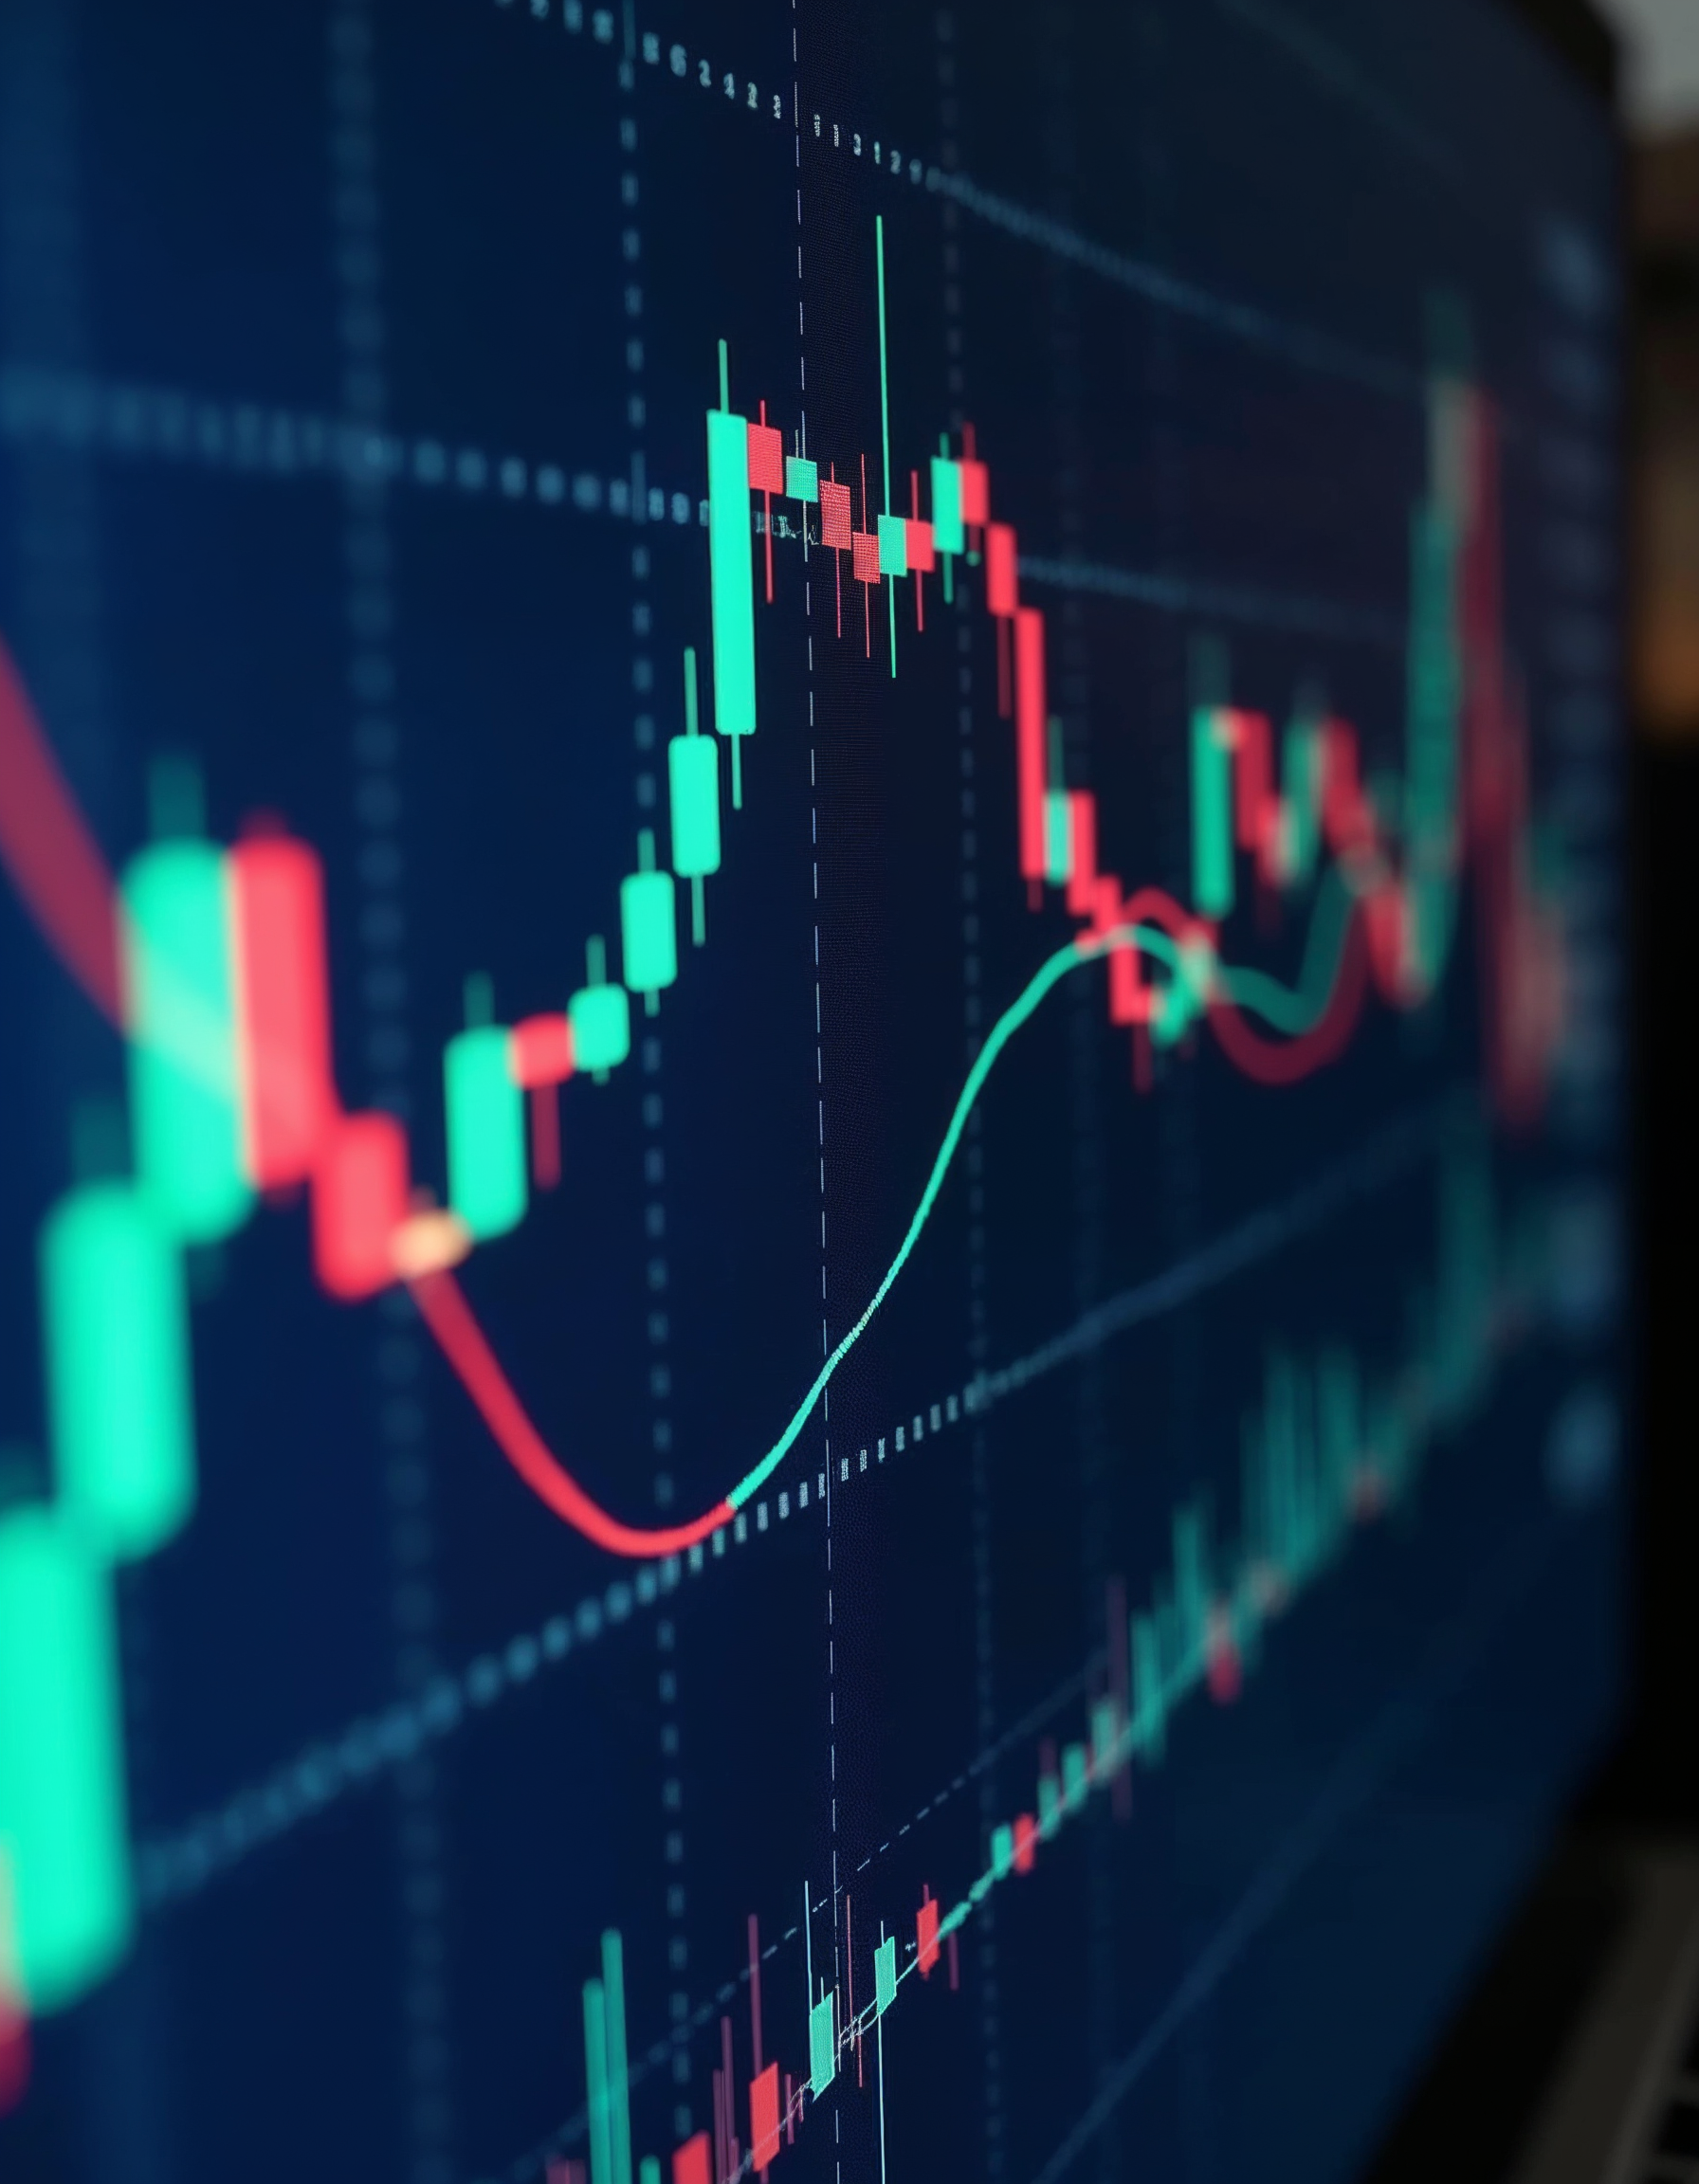
A close-up view of a computer screen displaying stock market charts and graphs with fluctuating lines and colors, suggesting financial data and analysis
Track real-time market movements with detailed stock charts and graphs. Analyze financial data through colorful fluctuating lines on your screen.
Need Help? Tailor Your Visuals! Bring your creative vision to life with our expert image customization services. Utilizing cutting-edge AI technology, we adapt each visual element to perfectly reflect your brand’s style and message. Visit the Customization page for details.
If you notice anything that seems off in the customized image or if it doesn’t meet your expectations, please use our Content Report page to let us know.
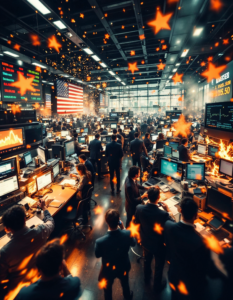
A stock exchange floor with traders frantically buying and selling commodities, capturing the volatility and excitement of the market

A stock market chart showing a series of candlestick patterns against a dark background, indicating the fluctuations of stock prices over time
A person’s hands using a tablet device to interact with various business analytics and data visualization elements displayed on the screen, including charts, graphs, and icons

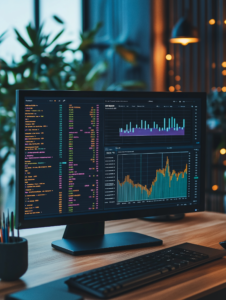
A digital dashboard displaying various performance metrics and indicators in real-time

Close-up of a surveillance camera lens, highlighting the role of technology in modern security

A speedometer integrated with digital data streams, symbolizing the importance of data and analytics in vehicle performance
A computer screen filled with graphs, charts, and data points, representing the power of data-driven decision-making in digital transformation
A close-up of a fitness tracker on someone’s wrist while they engage in an activity, symbolizing technology’s role in fitness

Blockchain technology and cryptocurrencies are disrupting traditional banking systems

Analyzing patient data to diagnose and treat illnesses

A tech professional working in a dimly lit office, surrounded by multiple screens showing code and cybersecurity alerts
A small business expanding into a larger operation, visualized by a small shop transforming into a skyscraper

A screen displaying complex data graphs, charts, and analytics, symbolizing how technology aids in decision-making and business intelligence

A scientist in a lab coat testing formulas in small vials, surrounded by ingredients, charts, and sensory analysis equipment

A robot advisor analyzing financial data and providing personalized investment recommendations

A person checking their health stats on a smartwatch, illustrating how wearable tech supports digital health monitoring

A labyrinth representing the complex and ever-evolving world of cryptocurrency and blockchain

A field where each plant has a digital tag hovering above it, displaying real-time data like moisture level and growth rate

A digital coin with intricate circuitry embedded within, representing the complex technology behind cryptocurrency

A data-driven documentary film using visualizations to tell a compelling story about social or environmental issues
A computer screen displaying charts and graphs on public health statistics, representing the importance of data in health planning