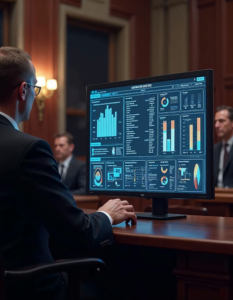
A tool that helps judges determine fair and consistent sentences based on data and precedents

An abstract sculpture formed by interconnected data points, showcasing the relationships and patterns within the data

A data-inspired dance performance, with movements and choreography reflecting data trends and patterns

A data sculpture that changes shape and color based on real-time data feeds, creating a dynamic and evolving artwork

A 3D visualization of a complex data set, allowing users to explore and interact with the data in a multi-dimensional space

A complexity visualization, using data and algorithms to represent complex systems and relationships

A group of developers working intensely on a project, fueled by caffeine and creativity

A close-up of a developer’s hands typing code on a keyboard, focuses on the human skill and creativity behind technology

A vast, dark space filled with glowing data points, where the AI acts as a powerful beam of light, extracting valuable insights and patterns

A screen displaying complex data graphs, charts, and analytics, symbolizing how technology aids in decision-making and business intelligence

A computer screen displaying code that transforms into a molecular model, symbolizing the fusion of data science and biology


