-

A tool that uses AI to analyze potential jurors and ensure a fair selection process
-

A professional at a computer station analyzing data from field sensors tracking air quality and carbon emissions
-

A specialist examining a simulation model of a city’s flood zones, pointing to projections on a large digital map
-

An abstract sculpture formed by interconnected data points, showcasing the relationships and patterns within the data
-

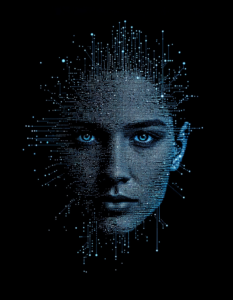
A human face composed of thousands of data points, with facial features morphing based on data trends
-
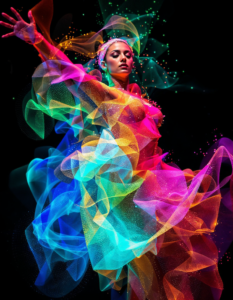
A data-inspired dance performance, with movements and choreography reflecting data trends and patterns
-

A data-driven music visualization, where sound waves and musical elements are transformed into visual representations
-

A data-driven documentary film using visualizations to tell a compelling story about social or environmental issues
-
A data portrait of a person, with their personality traits and interests visualized through data points and patterns
-

A 3D visualization of a complex data set, allowing users to explore and interact with the data in a multi-dimensional space
-

A weather balloon ascending into the atmosphere, gathering data to improve forecasting and research
-

A scientific laboratory analyzing DNA samples, searching for genetic evidence of cryptids
-

A complexity visualization, using data and algorithms to represent complex systems and relationships
-

A scientist studying marine life in a submersible, conducting research to understand and protect the ocean
-

A futuristic bar scene with robotic bartenders creating innovative and personalized cocktails
-

Smart office with automated lighting, temperature control, and energy efficiency, emphasizes the use of technology for sustainability and comfort
-

A visual representation of multiple layers of a neural network, with data flowing through them, gradually transforming from raw input to refined output
-

A vast, dark space filled with glowing data points, where the AI acts as a powerful beam of light, extracting valuable insights and patterns
-

A stylized timeline with branching possibilities, where the AI illuminates the most probable path based on data analysis
-

A doctor reviewing a patient’s health data on a holographic display, with vibrant graphs and charts revealing insights and informing personalized treatment plans
-

A computer screen displaying charts and graphs on public health statistics, representing the importance of data in health planning
-

A businessperson walking across a bridge made of graphs and statistics, symbolizing how data-driven decisions guide career success
-

A robotic arm assembling a 3D model of the Earth, symbolizing the role of science in constructing our understanding of the planet
-

A pair of hands holding a globe with data streams flowing around it, symbolizing the global impact of scientific discoveries
-

A computer screen displaying code that transforms into a molecular model, symbolizing the fusion of data science and biology