A scientist in a lab coat testing formulas in small vials, surrounded by ingredients, charts, and sensory analysis equipment

A professional guiding a patient through a rehabilitation exercise in a gym-like clinical space, with resistance bands and charts on the wall

A mapmaker drawing the paths of sound waves through a canyon, their charts glowing with sonic vibrations

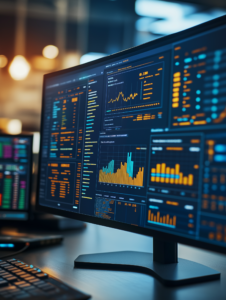
A computer screen filled with graphs, charts, and data points, representing the power of data-driven decision-making in digital transformation

A computer screen displaying charts and graphs on public health statistics, representing the importance of data in health planning

A screen displaying complex data graphs, charts, and analytics, symbolizing how technology aids in decision-making and business intelligence

A well-organized teacher’s desk filled with teaching materials, books, and classroom supplies, highlighting the preparation and organization involved in teaching

A briefcase filled with graphs and charts spilling out, symbolizing the tools and strategies of financial planning

A digital dashboard displaying various performance metrics and indicators in real-time

A data scientist working late at night in a modern office, surrounded by multiple computer screens filled with data visualizations and coding

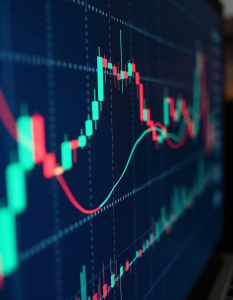
A close-up view of a computer screen displaying stock market charts and graphs with fluctuating lines and colors, suggesting financial data and analysis


